
- Analyst remains certain that a bullish Bitcoin rally will occur.
- He expects BTC to hit a new ATH in the $145,000 price range.
- Details breakdown of previous price movements supports this pump expectation.
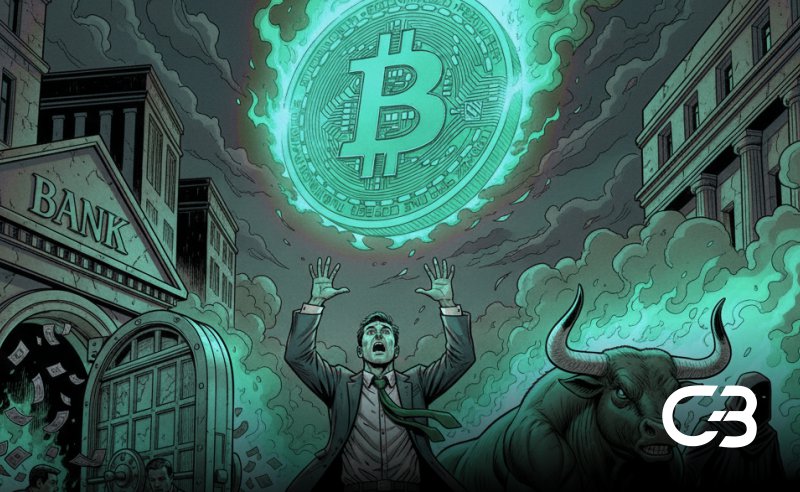
As the price of Bitcoin continues to move in a steady sideways movement, while still remaining in the 6-digit price range, analysts grow eager to see a much stronger price rally for the pioneer crypto asset. Amidst the growing bearish expectations, one analyst remains certain that a bullish Bitcoin rally will take BTC price to $145,000 at least, from its current price level.
Analyst Remains Certain That a Bullish Bitcoin Rally Will Occur
According to CoinMarketCap analytics, the price of BTC is currently trading in the $105,000 price range, indicating a dip of 0.9% in the past 24 hours. It boasts a total market cap of $2,097,309,572,743.76 and a 24-hour trading volume of $69,244,089,322.83. The asset will need a pump of over 16% to hit its previous ATH price in the $126,000 price range and only a few analysts are still hoping for BTC to hit a higher ATH price this cycle.
As we can see from the post above, this is one such analyst. The post goes on to state that Bitcoin is going to rally to at least $145,000 from here, stating that there is a 99% chance it will find at least its local bottom in the next 5 days. This is based on the last 7 years’ worth of Death Cross data since the beginning of the 2017 bull run. The data also shows how every time the 1D 50SMA and 200SMA cross over to the downside, that is called a Death Cross.
To highlight, every single time BTC has done it in the last 7+ years, it has marked at least a local bottom within about 5 days, with at minimum a 45% rally from the low. Thus, he declares that the market is about to get the next Death Cross in about 5 days from now. He then recalls the previous times BTC reacted so, March 28, 2018 – local bottom on the day it crossed at $6,480, price rallied by 50%.
The Price of BTC Could Hit $145,000 ATH Soon
Similarly, on October 26, 2019 – local bottom on the day it crossed at $7,337, price rallied by 50% and March 25, 2020 – actual bottom 9 days before the death cross at $3,907. Price went on to 17x pump to 2021 ATH. Adding on, June 19, 2021 – actual bottom 3 days after death cross at $28,800, price rallied by 130% to 2021 second ATH and Jan 14, 2022- local bottom 7 days after death cross at $33,000, price went on to rally 45%.
Finally, he reaches the latest patterns, starting from September 11, 2023 – actual bottom on the day of the death cross, price went on to rally 200% to new highs and August 8, 2024 – actual bottom 3 days before the death cross, price went on to rally 120% to new highs. Lastly, April 6, 2025 – actual bottom on the day of the death cross, price went on to rally 69% to new highs.
He concludes by saying that ever bearish traders should see how in every bear market it has provided at least a 50% pump before continuing to new lows. In the absolute worst-case scenario, BTC is going nicely to higher targets before lower. These outcomes have only happened in a bear market, which he does not believe the market is in at the moment. He finishes by stating that the best-case scenario now is that BTC rallies strongly to new highs.